Claim
The fully reusable system can achieve a mass-to-orbit ratio (mass-in-stable-orbit over takeoff-mass) of 4.64%.
Evidence
The mass-to-orbit ratio is a useful metric for comparing and contrasting the fundamental performance of two different rocket technologies. For one system to have a better mass-to-orbit ratio than another, it will need to demonstrate improvements on fundamental rocket performance metrics, such as engine thrust, engine ISP, or structural mass fraction.
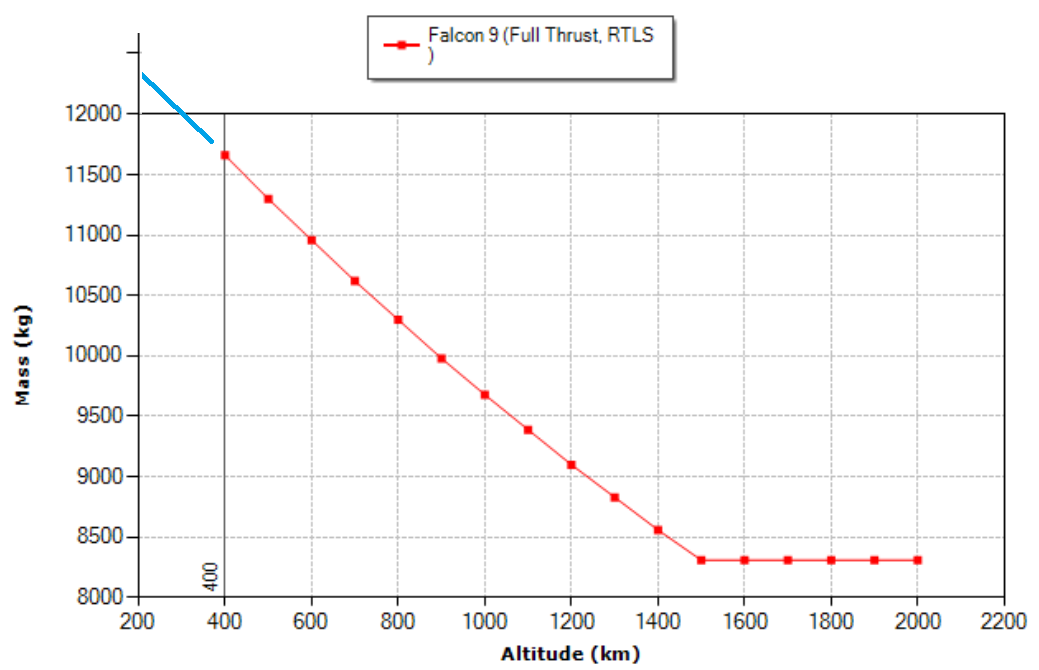
For example, Falcon 9 is an operationally proven system which has a configuration in which the booster returns to the launch site (called the "RTLS" configuration) - this is similar to the Starship system where the booster also returns to the launch site. In the RTLS configuration, its payload (12,300 kg) can be accurately obtained from NASA's Launch Vehicle Performance Website (see figure below). Its mass on the pad (not including payload) can be found on SpaceX's website and is 549,054 kg. Its takeoff mass is thus . Its mass in a 200 km circular orbit is estimated to be . This means that it achieves a mass-to-orbit ratio of
Starship is an evolving design and official numbers are not published, but there are many public estimates. For example, Starship's takeoff mass is estimated to be ~5,000 metric tons. The second stage's dry mass is unknown but some public analyses, based on Elon Musk’s past comments and performance targets, estimate the Starship upper stage dry mass to be on the order of 100–150 metric tons. The aspirational payload to orbit is 100+ metric tons. The propellant needed for the deorbit and landing burns is estimated to be 32 tons. Therefore, its mass-to-orbit ratio is likely to be at least
Thus, SpaceX will need to increase Starship's performance on the mass-to-orbit ratio metric, relative to Falcon 9 RTLS, by a factor of at least .
SpaceX's Starship differs from the Falcon 9 RTLS in the following ways:
- The primary fabrication material is changed from aluminum-lithium alloy to stainless steel.
- The fuel is switched from RP-1 to methane.
- The engines are upgraded from an open gas-generator cycle to full-flow staged combustion.
- A hot-staging technique is used when the second stage separates from the first stage.
- The booster does not execute a re-entry burn, but instead relies on atmospheric drag to decelerate it.
- The second stage does not reduce it's mass during ascent by jettisoning its fairings.
- The second stage uses a mix of sea-level and vacuum-optimized engines instead of a purely vacuum-optimized engine.
- The second stage includes a thermal protection system and aerodynamic control surfaces, increasing drag but enabling reuse.
- The booster is recovered via a “tower catch,” permitting landing legs to be removed.
- The takeoff mass of the rocket in increased by roughly 9X, enabling some mass savings associated with square-cube law effects.
While some of these changes are likely to degrade performance and others are likely to increase it.
This claim asserts that the net effect of all of these changes will achieve at least a 1.6X performance improvement.
Reviews
The following reviews are limited in scope to the validity of the claim made above, and do not imply that the reviewer has taken a position regarding any other claim or the overall feasibility of a concept that is supported by this claim.
- 1
 Reputation: 0Verdict: ChallengesI am trained in the physics and engineering of launch vehicles, with specific expertise in propulsion performance analysis, structural mass modeling, ascent trajectory dynamics, and stage-level optimization using the rocket equation. My background includes evaluating liquid-propellant engines, material selection trade-offs, flight-load margining practices, and multi-stage vehicle architecture. These areas directly support assessing mass fractions, specific impulse effects, aerodynamic penalties, and recovery-system impacts on overall vehicle performance. I rely exclusively on publicly available specifications, established material properties, and industry-standard analytical methods to produce transparent, reproducible evaluations such as the one presented here.
“A careful rocket-equation analysis shows about a 10–15% improvement, not the 60% the claim requires.”
My first step was to sanity-check the numerical inputs used in the claim. The Falcon 9 RTLS values are well constrained by published specifications and mission performance data, so they form a reliable calibration target. The Starship values are less certain—its total liftoff mass, upper-stage dry mass, and reusable payload targets are still evolving—but the numbers used in the claim are representative of widely circulated expectations and are reasonable baseline assumptions. From that standpoint, the claim’s required mass-to-orbit ratio is appropriate to examine.
Under the claim’s definition, Starship needs to outperform Falcon 9 RTLS by roughly 60%.
To ground the evaluation, I built a two-stage rocket-equation model incorporating gravity and drag losses, a short staging interval penalty, and a fairing-jettison event for Falcon 9. The unknown parameters—primarily the Δv split and lumped loss terms—were tuned only until the model reproduced the Falcon 9 mass-to-orbit ratio stated in the claim. Because this was achieved without stretching any inputs beyond realistic bounds, the model serves as a reasonable baseline.
With the calibrated baseline in hand, I then examined each design difference listed in the claim by rerunning the model with only that one parameter changed. This provides an approximate factor describing how each design change affects the mass-to-orbit ratio. After extracting the individual factors, I also ran the model with all effects applied simultaneously to verify consistency.
Formulas Used in the Model
Structural mass fraction
Dry-to-propellant ratio
Initial and final stage masses
Mass ratio
Stage delta-v
Total mission delta-v constraint
Mass-to-orbit ratio (as defined in the claim)
The calibration step adjusts Δv₁ / Δv₂ and Δvₗₒₛₛₑₛ until Falcon 9 RTLS produces the expected value of f.
Baseline Parameter Definitions and Values
The following parameters reproduce the Falcon 9 RTLS mass-to-orbit ratio in the calibrated two-stage model.
Parameter Symbol Value Notes First-stage dry mass 25.6 t Falcon 9 booster First-stage propellant mass 395.7 t Falcon 9 booster Second-stage dry mass 3.9 t Falcon 9 upper stage Second-stage propellant mass 92.7 t Falcon 9 upper stage First-stage effective Isp 300 s Includes atmospheric operation Second-stage Isp 348 s Merlin Vacuum Total mission — 9.35–9.45 km/s Includes gravity and drag losses Fairing mass (jettisoned) — 1–1.2 t Removed before S2 burn These parameter values serve as the baseline for calculating multiplicative factors when individual design changes are introduced.
Material Property Comparison: Aluminum-Lithium vs Stainless Steel
To estimate the structural penalty of switching from Al–Li to stainless steel, we compare strength-to-weight ratios using published material properties.
Material Properties
Material Density (g/cm³) Yield Strength (MPa) Strength-to-Weight Ratio (MPa·cm³/g) Al–Li 2195 2.65 480 Stainless 301 (CW) 7.93 930 (typical CW value) Relative Structural Efficiency
Strength-to-weight efficiency ratio:
Thus, for comparable structural margins:
Meaning:
A stainless-steel structure must be ~54% heavier than an Al–Li structure to provide the same load-carrying capacity.In the two-stage model, this corresponds to a multiplicative penalty:
after accounting for the fact that the structural penalty interacts with the rocket equation rather than being a simple proportional mass addition.
Sensitivity-Style Factor Table
Each factor below was obtained by rerunning the calibrated two-stage model while changing only the indicated design element and holding all others fixed. Values represent multiplicative effects on the mass-to-orbit ratio.
Design Change Factor Explanation Material change: Al–Li → Stainless Steel 0.91 Structural efficiency drops to ~65% of Al–Li; ≈54% more structural mass required to maintain margins. Propellant & engines: RP-1/Merlin → CH₄/Raptor 1.17 Booster Isp 300→320 s; upper-stage thrust-weighted Isp 348→365 s; improved Δv efficiency. Upper-stage engine mix: SL + Vac Raptors 0.98 Mixed nozzles reduce effective Isp relative to an all-vacuum engine configuration. Hot staging 1.02 Reduced gravity losses during the staging interval; smoother Δv continuity. TPS and flaps (treated as drag penalty only) 0.95 Increased reference area slightly increases atmospheric drag during ascent. Booster recovery method (no dedicated re-entry burn) 1.03 Additional booster propellant contributes to ascent rather than recovery braking. No fairing jettison (Starship nose remains attached) 0.97 Slight inert-mass penalty before second-stage burn; modest effect on Δv. Scale: 3.7 m → 9 m class vehicle 1.05 Larger tanks have better surface-to-volume efficiency, reducing relative structural mass. Combined Factor (Product of All Individual Factors)
Model-Predicted Starship Mass-to-Orbit Ratio
(when all effects are applied simultaneously)
If Falcon 9 RTLS has:
then the model predicts:
or roughly 3.2–3.4%, depending on the precise Δv split and loss terms.
This is well below the 4.64% required by the claim.
Engineering Margins and Unmodeled Uncertainties
Rockets are not designed to operate at their theoretical structural limits. They include engineering margins intended to protect against fatigue, manufacturing variability, buckling instabilities, load-path uncertainties, thermal distortion, dynamic loads, and off-nominal flight conditions.
Typical aerospace structural margins (representative of launch vehicles):
-
Yield margin: 20–40%
The structure must remain safely below yield under worst-case operational loads. -
Ultimate margin: 40–60%
Ensures survival under unexpected load spikes or load-path shifts. -
Buckling margin: 25–50%
Especially important for thin-walled cylindrical tanks under compressive loads or bending. -
Fatigue knockdown: 15–30%
Applied to account for cyclic loading, weld quality, and crack-initiation behavior.
Since stainless steel tanks in Starship replace Al–Li tanks in Falcon 9, the question arises whether SpaceX has achieved lower structural margins through better load modeling, improved manufacturing control, or flight-proven inspection and validation techniques.
At present, no public evidence indicates that Starship is designed with margin reductions beyond standard practice for orbital launch vehicles. If such reductions exist, they could partially offset the structural penalty associated with stainless steel, but without verified data, the model conservatively assumes equivalent margins for both vehicles.
Conclusion
Applying only the enumerated design changes to a calibrated Falcon-derived rocket model produces a mass-to-orbit improvement of roughly 13%, not the 60% needed to validate the claim. Even allowing for optimistic assumptions, the combined effects of material choice, engine performance, aerodynamic surfaces, staging method, recovery profile, and scale cannot yield a factor near 1.6. Therefore, based on physically justified modeling, the claim is not supported.
Submitted: · Edited: -